Chapter 6: Finding a voice: 1763–1776
Packages
library(readxl)
library(janitor)
library(lubridate)
library(scales)
library(patchwork)
library(tidyverse)

# ggplot_extras ####

theme_set(theme_minimal()) # set preferred ggplot theme
theme_update(plot.title = element_text(size = rel(1.1), hjust = 0)) # adjustments to theme
update_geom_defaults("line", list(size = 0.85))
Crime Prosecutions
c6_ob <-
  read_xlsx("datasets/Crime_Prosecutions.xlsx", sheet = "Old Bailey", skip = 2) %>%
  clean_names(case="lower_camel")

c6_bridewell <-
  read_xlsx("datasets/Crime_Prosecutions.xlsx", sheet = "Bridewell", skip = 2) %>%
  clean_names(case="lower_camel")

c6_ob_brd_long <-
  bind_rows(
    c6_bridewell %>% filter(between(year, 1763,1776)) %>%
      select(year, bridewell, bridewellEstimated=estimatedValues)  %>%
      gather("k", "v", bridewell, bridewellEstimated)
    ,
    c6_ob %>% filter(between(year, 1763, 1776)) %>%
      select(year, oldBailey= totalCorrected) %>%
      gather("k", "v", oldBailey)
  )


c6_fig1_labels <- c("Bridewell", "Bridewell\nEstimated", "Old Bailey")


c6_ob_brd_long_ggplot <-
c6_ob_brd_long %>%
  ggplot(aes(x=year, y=v, colour=k, group=k, linetype=k)) +
  geom_line() +
  scale_y_continuous(breaks = seq(0, 1800, 200), limits = c(0,1800)) +
  scale_x_continuous(breaks = seq(1763, 1776, 2)) +
  # info for colour scale and linetype scale must match...
  scale_colour_manual(values=c('#D55E00', '#D55E00','#0072B2'),
                      labels=c6_fig1_labels
  ) +
  scale_linetype_manual(values = c("solid", "dashed", "solid"),
                        labels= c6_fig1_labels
  ) +
  labs(x="year", y=NULL, title = "Figure 6.1: Crimes prosecuted, 1763-1776: The Old Bailey and Bridewell") +
guides(colour=guide_legend(title=NULL), linetype=guide_legend(title=NULL))c6_ob_brd_long_ggplot## Warning: Removed 11 row(s)
## containing missing values
## (geom_path).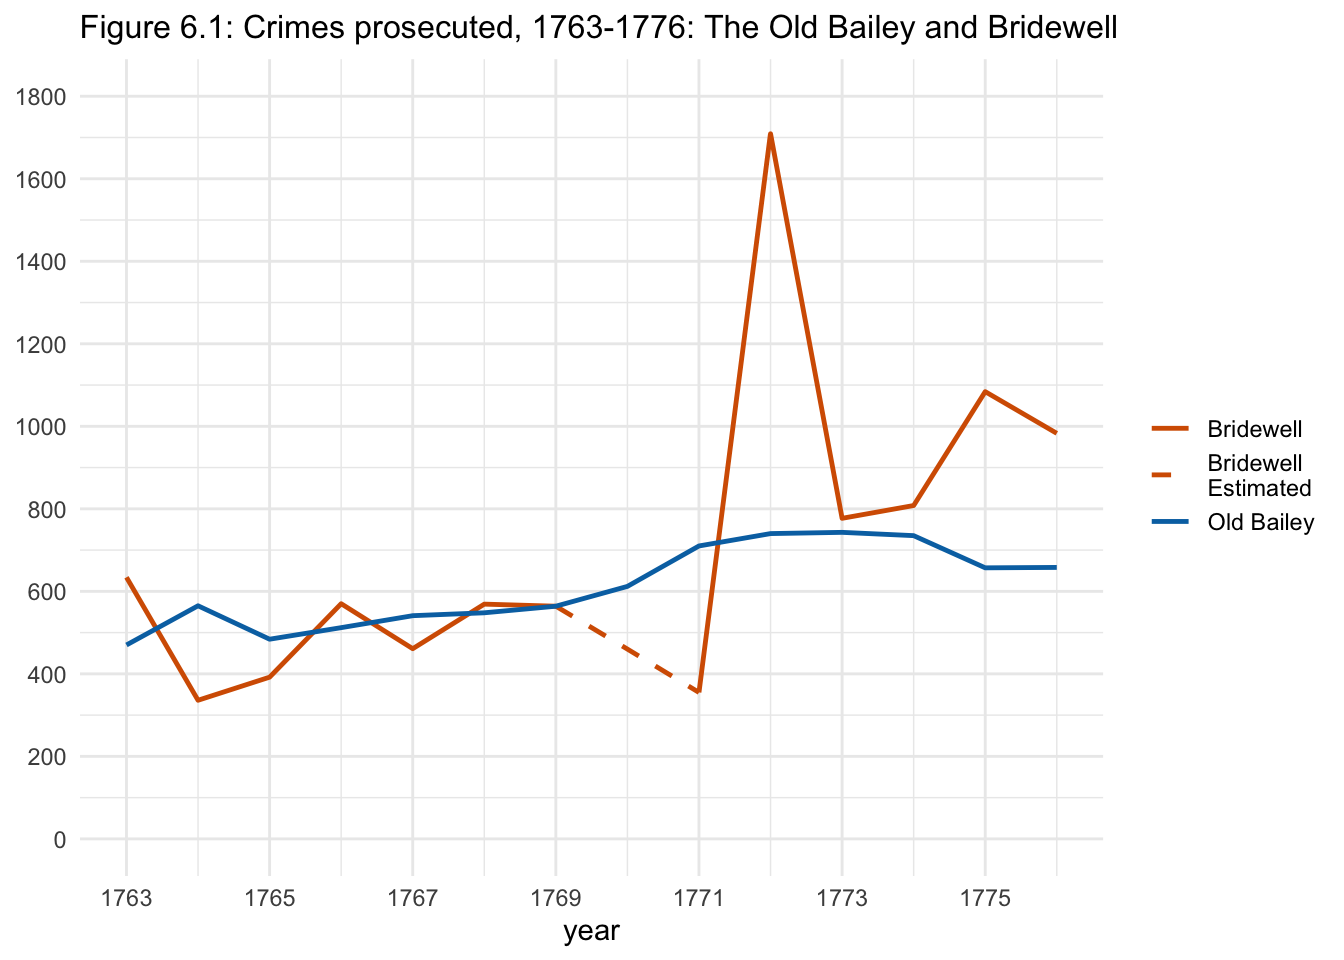
Figure 6.1: Crimes prosecuted, 1763-1776: The Old Bailey and Bridewell
Online dataset: Crime Prosecutions (xlsx)
Poor Relief Expenditure
c6_fig2_poor_relief_data <-
  read_excel("datasets/Poor_Relief_Expenditure_1690-1800.xlsx", skip=2, sheet="General") %>%
  clean_names(case="snake")
## Warning in read_fun(path =
## enc2native(normalizePath(path)),
## sheet_i = sheet, : Expecting
## numeric in C4 / R4C3: got a
## date## Warning in read_fun(path =
## enc2native(normalizePath(path)),
## sheet_i = sheet, : Expecting
## numeric in C8 / R8C3: got a
## date## Warning in read_fun(path =
## enc2native(normalizePath(path)),
## sheet_i = sheet, : Expecting
## numeric in C9 / R9C3: got a
## date## Warning in read_fun(path =
## enc2native(normalizePath(path)),
## sheet_i = sheet, : Expecting
## numeric in M69 / R69C13: got a
## date## Warning in read_fun(path =
## enc2native(normalizePath(path)),
## sheet_i = sheet, : Expecting
## numeric in N69 / R69C14: got a
## date## Warning in read_fun(path =
## enc2native(normalizePath(path)),
## sheet_i = sheet, : Expecting
## numeric in O69 / R69C15: got a
## date## Warning in read_fun(path =
## enc2native(normalizePath(path)),
## sheet_i = sheet, : Expecting
## numeric in O70 / R70C15: got a
## date## Warning in read_fun(path =
## enc2native(normalizePath(path)),
## sheet_i = sheet, : Expecting
## numeric in O71 / R71C15: got a
## date## Warning in read_fun(path =
## enc2native(normalizePath(path)),
## sheet_i = sheet, : Expecting
## numeric in F97 / R97C6: got a
## date## Warning in read_fun(path =
## enc2native(normalizePath(path)),
## sheet_i = sheet, : Expecting
## numeric in M97 / R97C13: got a
## date## Warning in read_fun(path =
## enc2native(normalizePath(path)),
## sheet_i = sheet, : Expecting
## numeric in N97 / R97C14: got a
## datec6_fig2_poor_relief_long2 <-
c6_fig2_poor_relief_data %>%
filter(between(year, 1763, 1776)) %>%
select(year, stcd_parl= st_clement_danes_parliamentary_returns, stcd_pr= st_clements_dane_casual_account, stdb_parl= st_dionis_backchurch_parliamentary_returns, stdb_pr= st_dionis_backchurch_poor_relief_expenditure) %>%
pivot_longer(stcd_parl:stdb_pr, names_to = "k", values_to = "v") %>%
mutate(parish_name = case_when(
str_detect(k, "stcd") ~ "St Clement Danes",
TRUE ~ "St Dionis Backchurch"
)) %>%
mutate(recs = case_when(
str_detect(k, "parl") ~ "parl_returns",
TRUE ~ "parish_recs"
)) %>%
select(-k) %>%
pivot_wider(names_from = "recs", values_from = "v")
c6_fig2_poor_relief_long2_ggplot <-
c6_fig2_poor_relief_long2 %>%
mutate(pl1 = "parish records", pl2 = "parliamentary returns") %>%
ggplot(aes(x=year)) +
geom_col(aes(y=parl_returns, fill=pl2)) +
geom_line(aes(y=parish_recs, colour=pl1)) +
facet_wrap(~parish_name, scales = "free_y", ncol = 1) +
scale_x_continuous(breaks=seq(1763,1776,2)) +
scale_colour_manual(values="black") +
scale_fill_manual(values="#D55E00") +
guides(colour=guide_legend(title=NULL), fill=guide_legend(title=NULL)) +
labs(y="£") +
plot_annotation(title= "Figure 6.2: Poor relief expenditure 1763-1776: St Clement Danes and St Dionis Backchurch", theme = theme(plot.title = element_text(hjust = 0.5))) # patchwork title to use the full width of the panelc6_fig2_poor_relief_long2_ggplot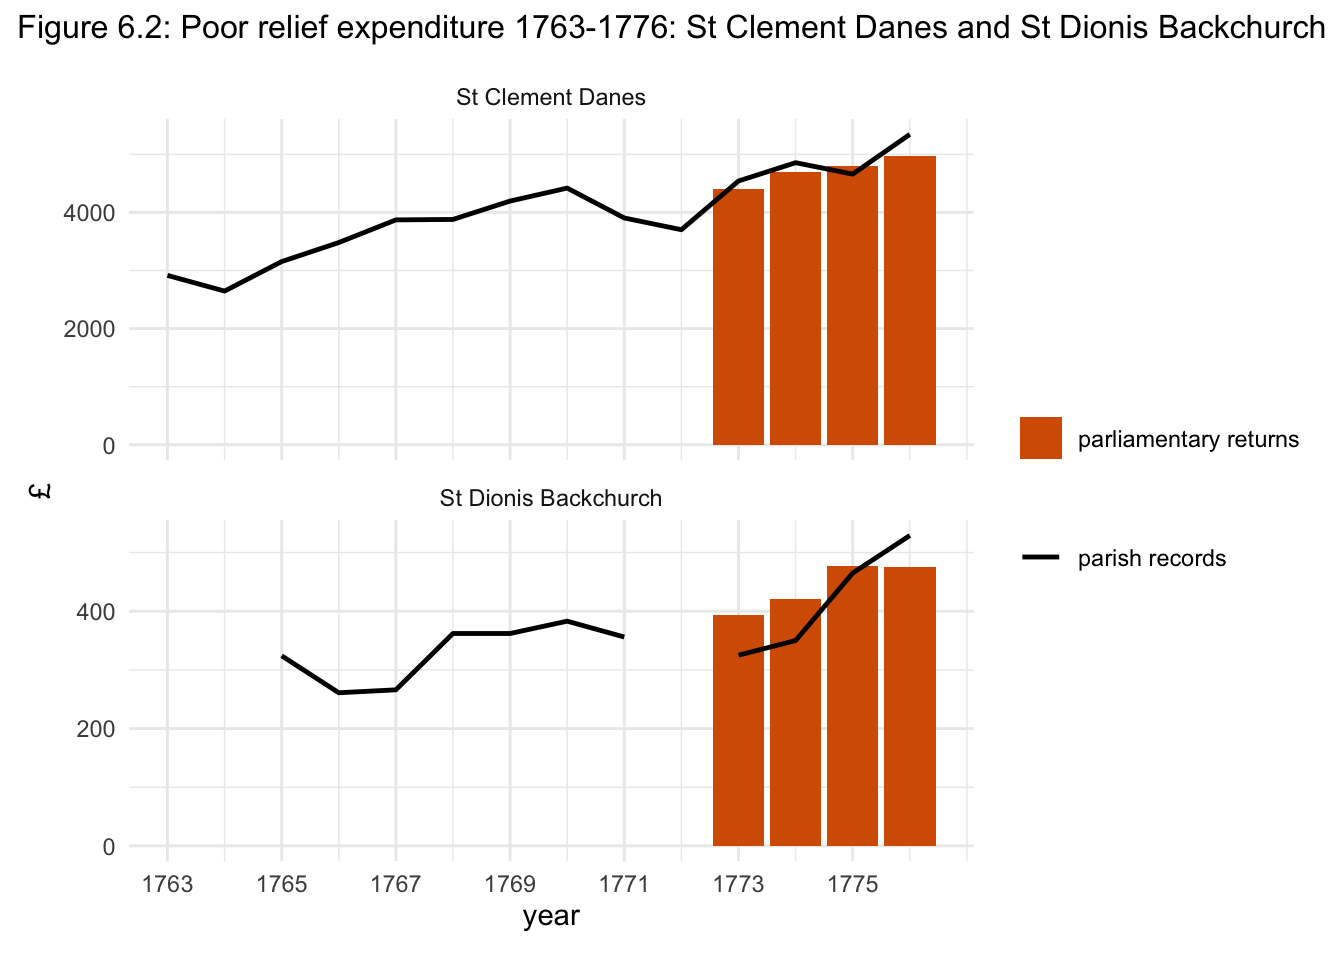
Figure 6.2: Poor relief expenditure 1763-1776: St Clement Danes and St Dionis Backchurch
Online dataset: Poor Relief Expenditure 1690-1800 (xlsx)
Vagrant Expenditure
c6_fig3_vagrant_expend_data <-
  read_excel("datasets/City_of_London_Vagrant_Expenditure_1738-1792.xlsx", skip=2, sheet = "Vagrant Expenditure") %>%
  clean_names(case="snake")

c6_fig3_vagrant_expend_data_ggplot <-
c6_fig3_vagrant_expend_data %>%
  filter(between(year, 1763, 1776)) %>%
  select(year, expenditure= total_expenditure_to_the_nearest) %>%
  ggplot(aes(x=year, y=expenditure)) +
  geom_line() +
  scale_x_continuous(breaks = seq(1763, 1776,2)) +
  labs(y="£", title = "Figure 6.3: City of London vagrant expenditure, 1763-1776")
c6_fig3_vagrant_expend_data_ggplot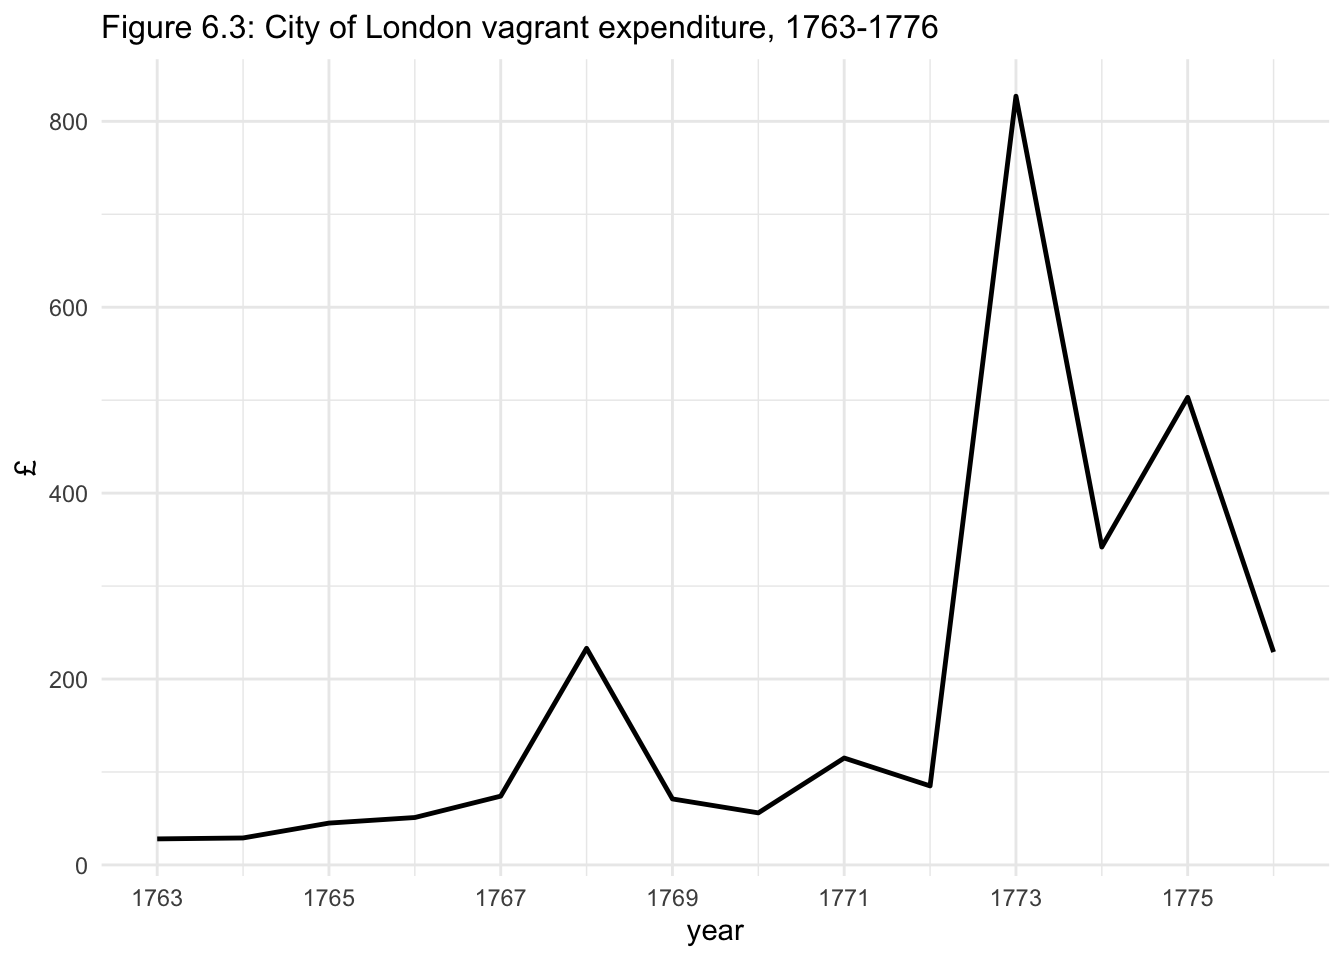
Figure 6.3: City of London vagrant expenditure, 1763-1776
Online dataset: City of London Vagrant Expenditure 1738-1792 (xlsx)
Punishments
pun1763 <-
  read_excel("datasets/Punishment_Statistics_1690-1800.xlsx", sheet = "Old Bailey Punishments", skip=2) %>%
  clean_names(case="lower_camel") %>%
  filter(x1 !="Total") %>%
  rename(year=x1) %>%
  mutate(year = as.double(year))
## New names:
## * `` -> ...1
## * `%` -> `%...4`
## * `%` -> `%...6`
## * `%` -> `%...8`
## * `%` -> `%...10`
## * ...pun_long_1763 <-
pun1763 %>%
filter(between(year, 1763, 1776)) %>%
select(year, total, corporal, death, transportation, imprisonment) %>%
gather("k", "v",corporal:imprisonment) %>%
mutate(pc = v/total*100)
c6_fig5_brk <- c("transportation", "death", "corporal", "imprisonment")
c6_fig5_labels <- c("Transportation", "Death", "Corporal", "Imprisonment")
c6_fig5_pun_long_1763_ggplot <-
pun_long_1763 %>%
ggplot(aes(x=year, y=pc, colour=k)) +
geom_line() +
scale_y_continuous(breaks = seq(0,80,10), limits = c(0,80)) +
scale_x_continuous(breaks = seq(1763, 1776, 2)) +
scale_colour_manual(values = c("#0072B2", "#D55E00", "#E69F00", "#CC79A7"),
breaks=c6_fig5_brk, labels=c6_fig5_labels) +
labs(x="year", y="% of sentences", title = "Figure 6.5: Old Bailey punishment sentences, 1763-1776") +
guides(colour=guide_legend(title=NULL), linetype=guide_legend(title=NULL))c6_fig5_pun_long_1763_ggplot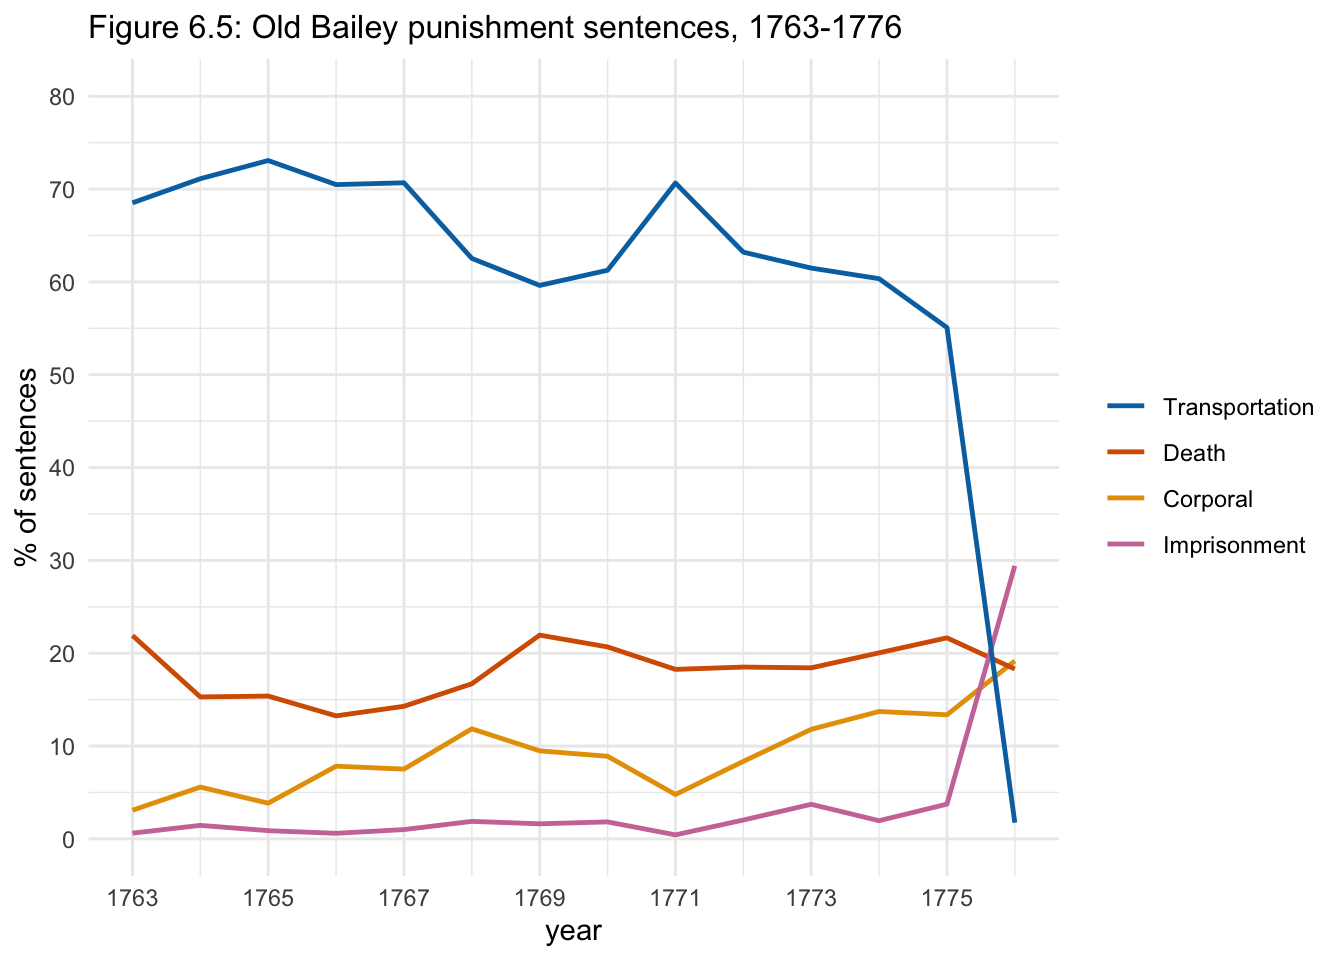
Figure 6.5: Old Bailey punishment sentences, 1763-1776
Online dataset: Punishment Statistics 1690-1800 (xlsx)