Chapter 3: Protest and resistance: 1713–1731
Packages
library(readxl)
library(janitor)
library(lubridate)
library(scales)
library(patchwork)
library(tidyverse)

# ggplot extras ####

theme_set(theme_minimal()) # set preferred ggplot theme
theme_update(plot.title = element_text(size = rel(1.1), hjust = 0)) # adjustments to theme
update_geom_defaults("line", list(size = 0.85))
Offences Prosecuted
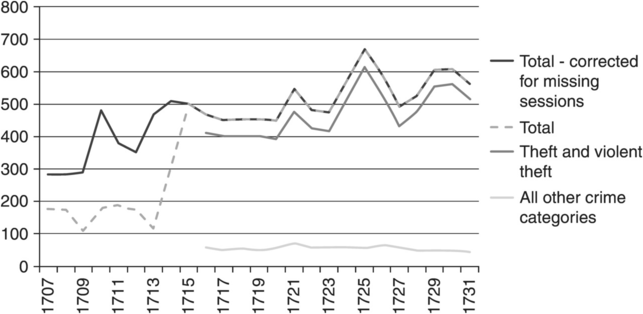
This was another dataset with a missing data problem, which the authors had handled slightly differently. Here’s the original graph:
c3_ob1707 <-
  read_xlsx("datasets/Crime_Prosecutions.xlsx", sheet = "Old Bailey, 1707-31", skip=1) %>%
  clean_names(case="lower_camel")

c3_ob_long <-
  c3_ob1707 %>%
  filter(between(year, 1707, 1731)) %>%
  select(year, totalOffences, totalCorrected, theftAndViolentTheft, allOtherOffences = excludingTheftAndViolentTheft) %>%
  gather("k", "v",totalOffences:allOtherOffences)


c3_fig1_brk <- c("totalCorrected", "totalOffences", "theftAndViolentTheft", "allOtherOffences")

c3_fig1_labels <- c("Total \n(corrected for\nmissing sessions)", "Total \n(uncorrected)", "Theft and\nViolent Theft", "All Other\nOffences")

c3_ob_long_ggplot <-
  c3_ob_long  %>%
  filter(k!="totalOffences"|year<1716) %>%
  ggplot(aes(x=factor(year), y=v, colour=k, group=k, linetype=k)) +
  geom_line(na.rm = TRUE) +
  scale_y_continuous(breaks = seq(0,750, 150), limits = c(0,750)) +
  scale_x_discrete(breaks = seq(1707, 1731, 2)) +
  scale_colour_manual(values=c("#0072B2", "#0072B2", "#E69F00", "#D55E00"),
                      breaks=c3_fig1_brk, labels=c3_fig1_labels
  ) +
  scale_linetype_manual(values = c("solid", "dotted", "solid", "solid"),
                        breaks=c3_fig1_brk, labels=c3_fig1_labels
  ) +
  theme(legend.text = element_text(margin = margin(t = 0.1, b=0.1, unit = "cm")) ) +
  guides(colour=guide_legend(title=NULL), linetype=guide_legend(title=NULL)) +
  labs(x="year", y="", title = "Figure 3.1: Offences prosecuted at the Old Bailey, 1707–1731")
My solution for this is very slightly different, but I think it’s near enough (nobody complained).
c3_ob_long_ggplot 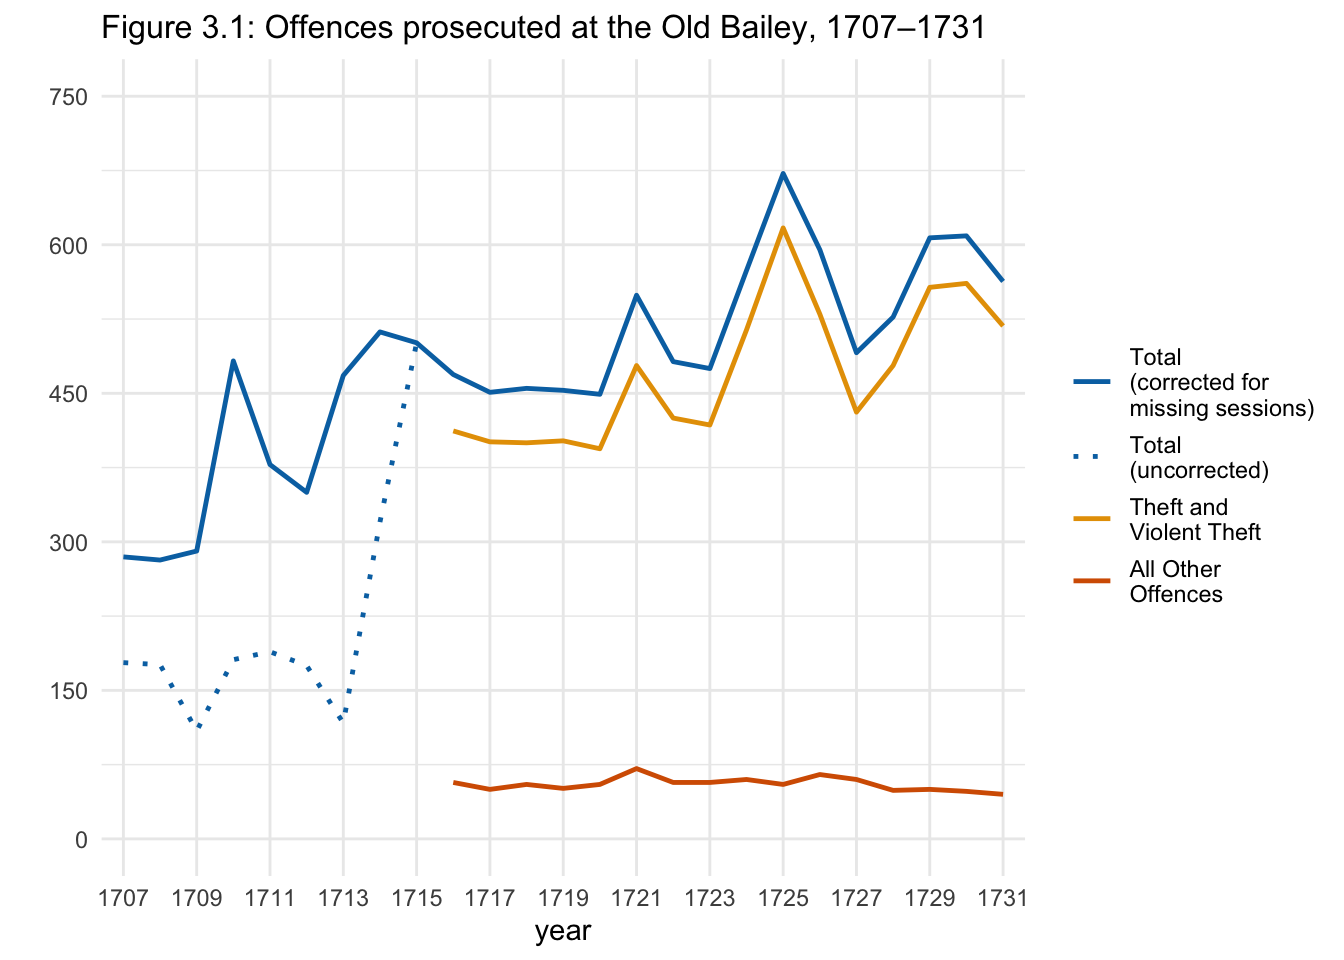
Figure 3.1: Offences prosecuted at the Old Bailey, 1707–1731.
Online dataset: Crime Prosecutions (xlsx)
Old Bailey Punishments
pun1690 <-
  read_xlsx("datasets/Punishment_Statistics_1690-1800.xlsx", sheet = "Old Bailey Punishments", skip=2) %>%
  clean_names(case="lower_camel") %>%
  filter(x1 !="Total") %>%
  rename(year=x1) %>% mutate(year = as.double(year))
## New names:
## * `` -> ...1
## * `%` -> `%...4`
## * `%` -> `%...6`
## * `%` -> `%...8`
## * `%` -> `%...10`
## * ...pun_long_1713 <-
pun1690 %>%
filter(between(year, 1713, 1731)) %>%
select(year, total, corporal, death, branding, miscellaneous, noPunishment, transportation, imprisonment) %>%
gather("k", "v",corporal:imprisonment) %>%
mutate(pc = v/total*100)
c3_fig2_brk <- c("corporal", "death", "branding", "miscellaneous", "noPunishment", "transportation", "imprisonment")
c3_fig2_labels <- c("Corporal", "Death", "Branding", "Miscellaneous", "No punishment", "Transportation", "Imprisonment")
c3_pun_long_1713_ggplot <-
pun_long_1713 %>%
ggplot(aes(x=year, y=pc, colour=k, group=k)) +
geom_line() +
scale_y_continuous(breaks = seq(0,80,10), limits = c(0,80)) +
scale_x_continuous(breaks = seq(1713, 1731, 2)) +
scale_colour_manual(values=c("#E69F00", "#56B4E9", "#009E73", "#F0E442", "#0072B2", "#D55E00", "#CC79A7"),
breaks=c3_fig2_brk, labels=c3_fig2_labels) +
guides(colour=guide_legend(title=NULL), linetype=guide_legend(title=NULL)) +
labs(x="year", y="% of sentences", title="Figure 3.2: Old Bailey punishment sentences, 1713–1731")c3_pun_long_1713_ggplot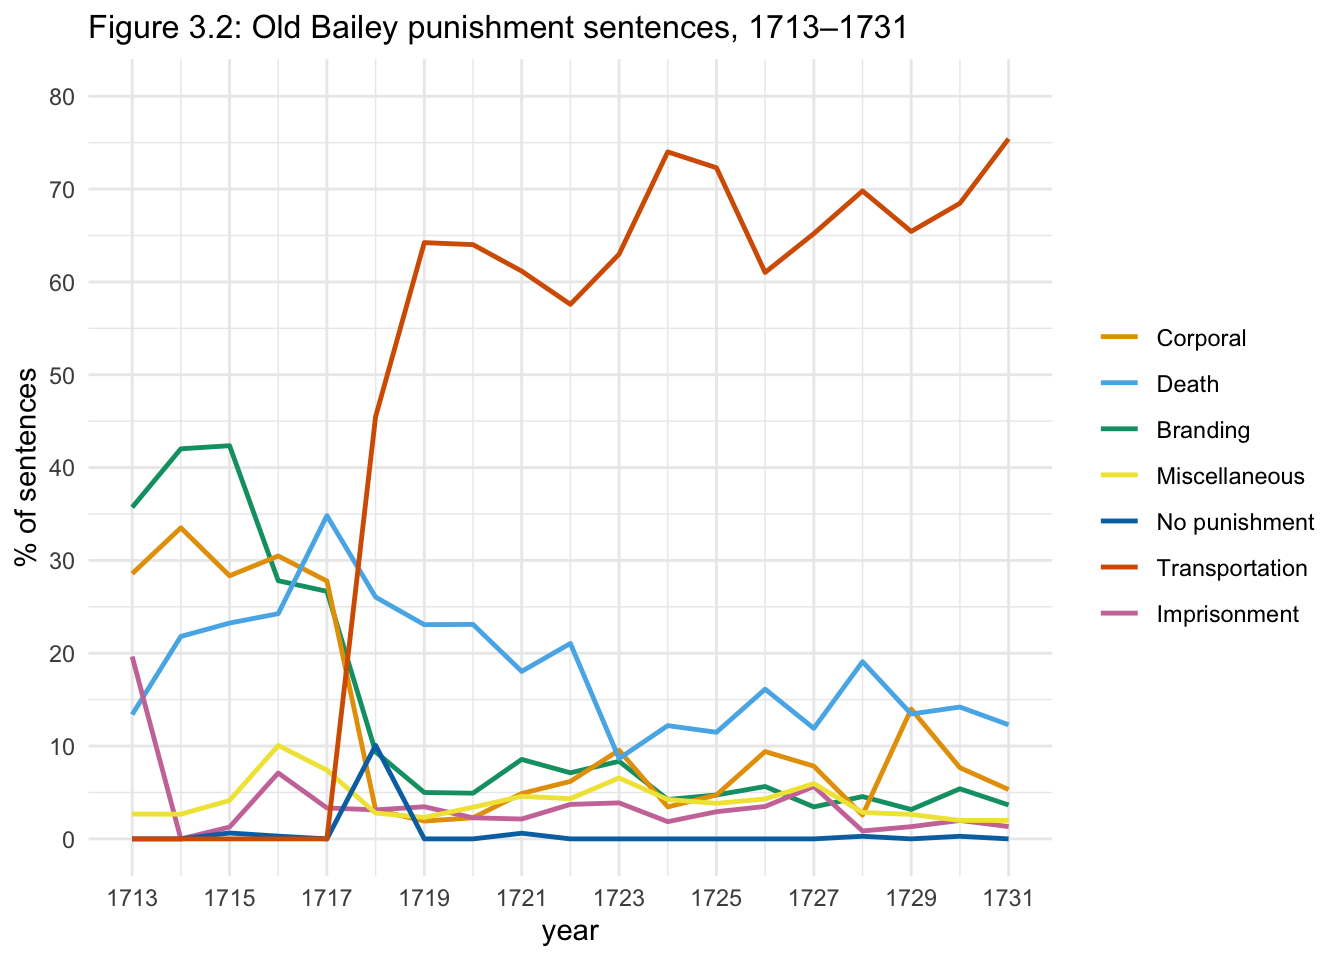
Figure 3.2: Old Bailey punishment sentences, 1713–1731.
Online dataset: Punishment Statistics 1690-1800 (xlsx)
SRM Prosecutions
srm1693 <-
  read_xlsx("datasets/SRM_Prosecutions_1693-1738.xlsx", sheet = "Data", skip=2 ) %>%
  clean_names(case="lower_camel")

srm_long <-
  srm1693 %>%
  filter(between(year, 1715, 1731)) %>%
  mutate(drunkBawdyGaming = drunkenness + keepBawdyHouse + gaming) %>%
  select(year, totalOffences, lewdAndDisorderly, sabbathBreaking, swearingAndCursing, drunkBawdyGaming) %>%
  gather("k", "v", totalOffences:drunkBawdyGaming)


c3_fig3_brk <- c("totalOffences", "lewdAndDisorderly", "sabbathBreaking", "swearingAndCursing", "drunkBawdyGaming")

c3_fig3_labels <- c("Total offences", "Lewd and \ndisorderly", "Sabbath \nbreaking", "Swearing \nand cursing", "Drunkenness,\nBawdy house,\nGaming")


c3_srm_long_ggplot <-
srm_long  %>%
  # no values at all for 1719
  ggplot(aes(x=year, y=v, colour=k, group=k)) +
  geom_line() +
  scale_y_continuous(breaks = seq(0, 3500, 500)) +
  scale_x_continuous(breaks = seq(1715, 1731, 2)) +
  scale_colour_manual(labels=c3_fig3_labels, breaks=c3_fig3_brk,
                      values = c("#D55E00", "#E69F00", "#0072B2", "#F0E442", "#CC79A7")) +
  theme(legend.key.height = unit(1.7, "line")) +
  guides(colour=guide_legend(title=NULL), linetype=guide_legend(title=NULL)) +
labs(x="year", y="", title = "Figure 3.3: Societies for the Reformation of Manners prosecutions, 1713–1731")c3_srm_long_ggplot## Warning: Removed 10 row(s)
## containing missing values
## (geom_path).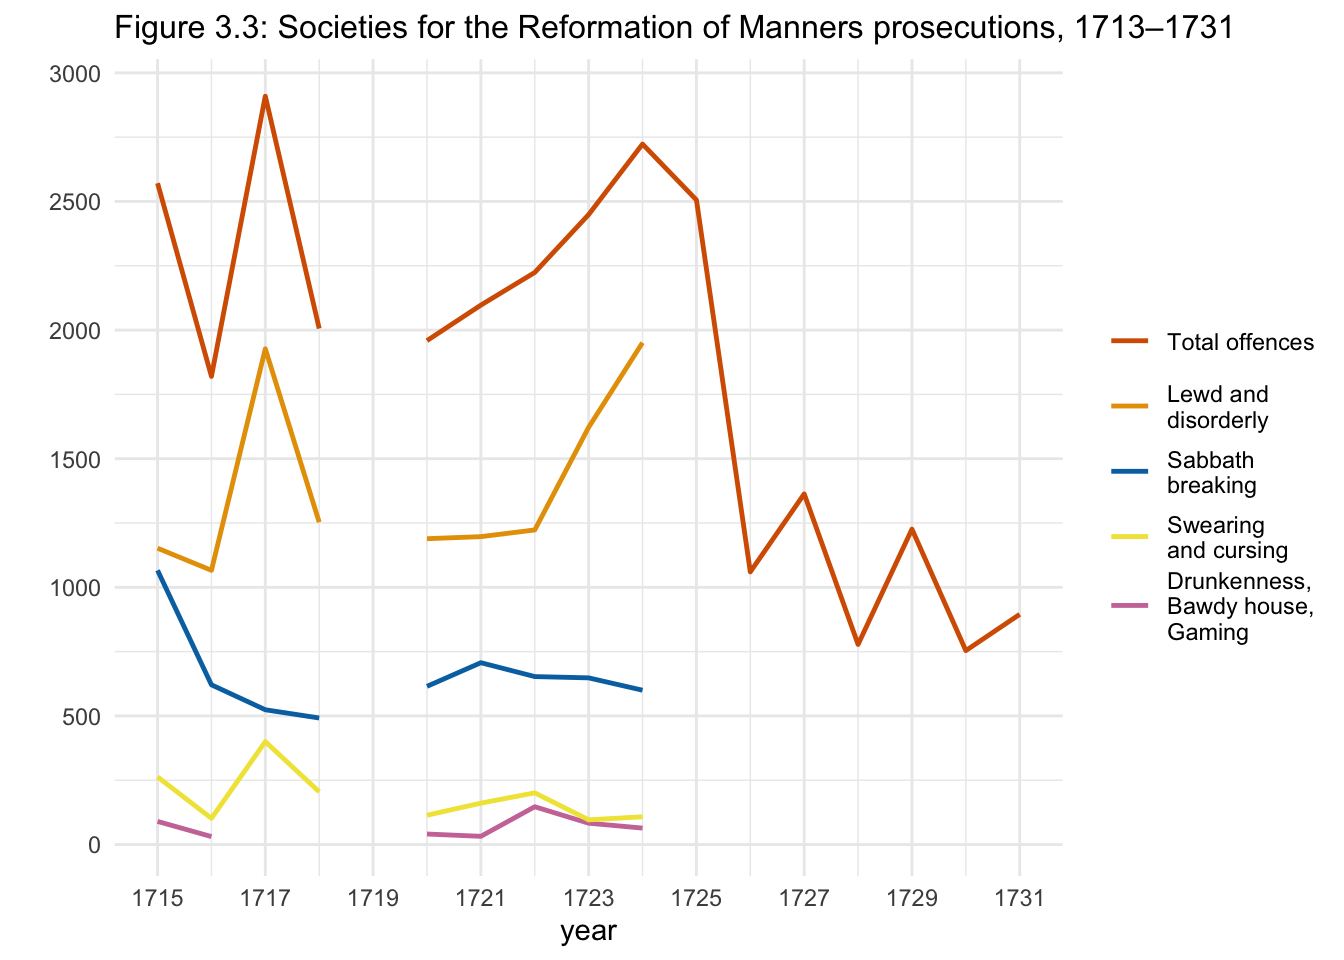
Figure 3.3: Societies for the Reformation of Manners prosecutions, 1713–1731.
Online dataset: SRM Prosecutions 1693-1738 (xlsx)