Appendix: The creation of an open access e-book and website
This appendix outlines the practical steps and tools involved in creating the e-book as a (relatively) lightweight website. It was made in HTML/CSS/Javascript, with no SQL database; it was intentionally designed so that it would be as straightforward as possible to add it to the London Lives website.
Part 1: File conversions: ??? to Markdown to RMarkdown
The essential framework for the book is Markdown, a lightweight “markup” format for writing in plain text, which can then be converted to HTML (or other formats). RMarkdown is a notebook format that can contain both Markdown text and R code, so that text and code can be woven together seamlessly.
The first essential requirement is to have the text in a suitable text format to turn into Markdown. In this case, the book chapters were in HTML; Word docs could also work (depending on how well formatted they are); XML could be another possibility. (In a perfect world, the text would be written in Markdown in the first place.)
For the conversion from HTML to Markdown, I used the conversion tool pandoc. (There was, as ever, a certain amount of manual cleaning and fixing work pre- and post-conversion to ensure the text was formatted exactly as I needed it.)
Most of the chapters included graphs that I wanted to rework in R. For that step, I needed to convert the Markdown into RMarkdown. Because there were only a few files, the easiest way to do this was to simply rename the file extensions from .md to .Rmd, ready to add R code “chunks” to replace the old image files.
Part 2: Creating visualisations in R
This work was done in RStudio. Using copies of the book’s datasets (which are also now openly available as spreadsheets), I re-made each of the 28 graphs in the book, mainly using packages from the Tidyverse, including ggplot2 for the actual charts.
Most are quite simple line charts of time series data. Some are a little more complex, including eg faceting (aka “small multiples”), moving averages and combined line and bar graphs. Most are as close as possible to the originals; all are intended to tell the same story. Changes include the abolition of dual axis charts and converting a couple of 3-D charts to 2-D because I didn’t think the 3-D effect aided clarity of presentation (full disclosure: I think it rarely does).
The bulk of the work consisted of extracting the required data from the spreadsheets and wrangling it into the right shape for ggplot to use. There is a lot of code re-use, with variations and extensions as needed. (I could and should have converted quite a bit of the code into functions. One day I’ll remember to do that and then maybe I’ll be a real programmer.)
The work was carried out at intervals over the course of a few months. As a result, I might not use exactly the same methods to do the same thing throughout the project, as I learn new functions or techniques. For example, much of the data is in “wide” formats which need to be reshaped to “long” formats to be visualised in ggplot. Initially I used the tidyr::gather() function for this, but half way through the tidyr developers released an update with a new and more intuitive pivot_longer() function for the same effect. I used this in parts of later chapters but decided not to rewrite the bulk of the already existing code (which should continue to work).
colours and accessibility
A common problem with data visualisation is readability for colour blind users. I tried to ensure that all the graphs are as readable as possible: I used the Okabe Ito colour palette (as implemented by Mike Mol) throughout. I implemented the colour scheme manually for each chart, checking them against a number of tools. (I primarily used the “I want to see like the colour blind” Chrome extension; I’m not sure if this is still available, but there are various other online tools.)
I had nearly finished the work when I saw this guide to dataviz for the colorblind. It was a bit too late to take on board all of the ideas and guidance it contains (and it includes a critique of the Okabe Ito palette), but I think I had at least attempted much of it and I very much hope that it’s been effective. (One tool I had managed to forget about until I read the article and wish I’d used more is Viz Palette.)
Part 3: Developing a website
I’d emphasise that Stack Overflow and Google (or your preferred web search engine) were probably the most essential tools for this part of the process, alongside a text editor (my choice is BBEdit).
CSS
For responsive CSS, most of the hard work was done by Bootstrap, and I think it would be perfectly possible to make a nice functional website-book with no further additions. But the book authors were keen to enhance the book in a number of ways. Most of their requests, in fact, related to navigation of the site/book in the absence of the page-based framework of a printed book.
on a small screen
sidebar/table of contents
A dynamic, context-dependent sidebar (or hidden menu on small screens) was implemented using Bootstrap’s scrollspy and shamelessly borrowed elements from the resume theme.
the sidebar
numbering sections and paragraphs
This was the best replacement we could devise for page numbers (for both navigation and citation of smaller sections than chapters). The fact that you can create counters purely using CSS was a complete revelation to me. There is a simple example here.
the index
A lot of hard work had gone into the original book index, which the authors didn’t want to lose. But it’s not at all easy to convert a paged index to an online version. It would be possible to create links in the text that index entries could point to directly, but that would have taken far more time and resources than were available for this project. As a compromise, I mapped the original page numbers to the chapter sections and used those as links, but I’m not really sure how well it’s worked (often the term in the index can’t be seen on the screen when you click through to the section and you might have to scroll down some way for it).
search
How do you do full-text search if you don’t have a SQL database? With Javascript, it turns out. There are not that many easy-to-use implementations, however, if you have fairly limited JS skills; the nicest option I found was the Tipue Search jQuery-based plugin.
footnotes
The authors wanted a way to be able to see the text of footnotes alongside reading the text. A first suggestion was sidenotes, which can be very effective, but I felt that there were simply too many notes (including too many long notes) for this to work. Instead, I opted for “tooltip” notes, (ie hover over the footnote number to see the note text). The javascript code to implement these was based on jQuery Inline Footnotes.
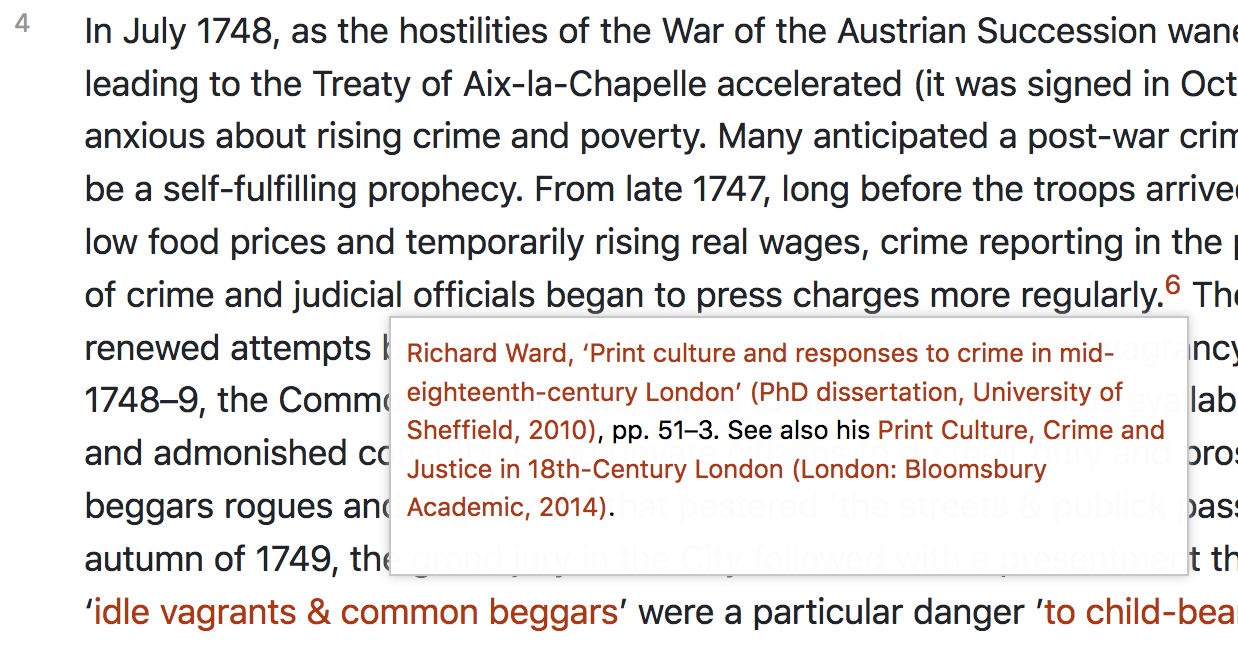
tooltip footnote
Part 4: Checking and proofreading
The authors, of course, wanted to check and update links and correct outstanding errors in the text (as well as writing a new preface). This was facilitated by the fact that they’re both comfortable with reading and writing in Markdown, so I could simply send them copies of the files, let them do what they wanted, and then (using my text editor’s compare changes functions, and making sure they hadn’t accidentally nuked any crucial formatting) incorporate the changes back into my Rmd files. It would have been less straightforward if they couldn’t have done this, though I think a Markdown-to-Word-to-Markdown workflow might be feasible.
Part 5: Building a website… several times!
Finally, I used the rmarkdown package to generate a website from the Rmarkdown/markdown files, associated graphics, dataset files, css and javascript files.
And, because it’s a website, I could easily make test versions of the book and put them online for feedback from the authors in an iterative development process over the course of several weeks. The final version was simply zipped up and sent to the team at the DHI to be added to London Lives.